Introduction
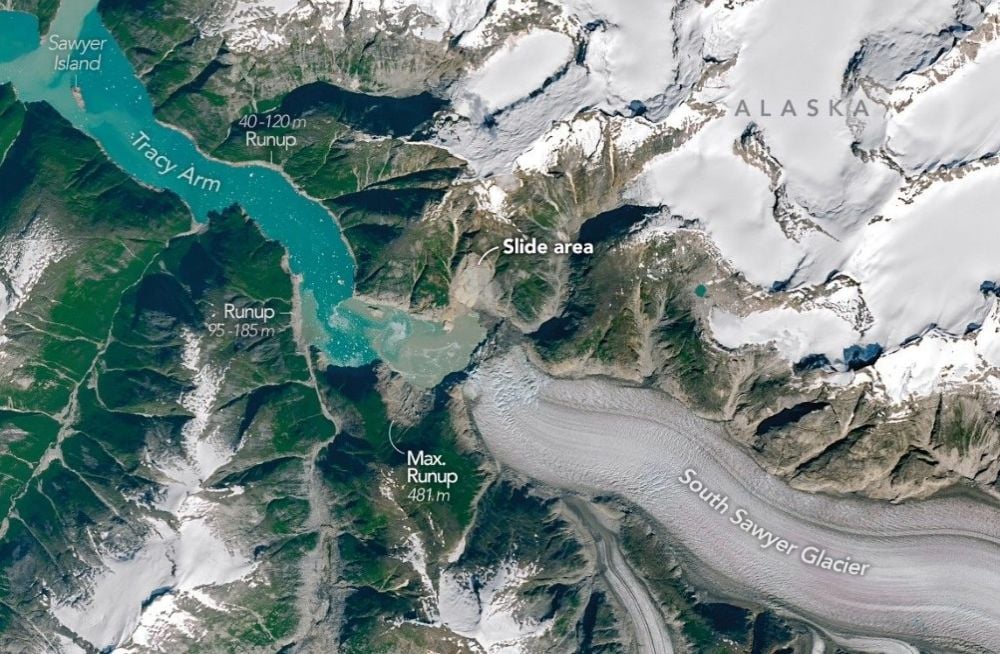
On the morning of 13 July 2025, a scarcely monitored alcove in southeastern Alaska’s Tracy Arm Fjord became the stage for one of the most spectacular geophysical chain reactions ever documented. A massive slope failure adjacent to the retreating South Sawyer Glacier suddenly collapsed, plunging tens of millions of cubic metres of rock, soil, and ancient glacial till into the confined fjord. Within seconds the violent impact displaced an equally massive volume of seawater, generating a megatsunami that tore down the narrow fjord with wave heights exceeding 481 m—second only to the infamous 1958 Lituya Bay tsunami. Although no fatalities occurred, the event was a clarion call for scientists, policy-makers, and coastal communities: in a warming world, rapidly thinning glaciers are creating over-steepened valley walls that are primed for catastrophic collapse.
This article provides an extensive, multidisciplinary analysis of the 2025 Tracy Arm landslide-tsunami, weaving together geological observations, hydrodynamic modelling, ecological field surveys, socio-economic data, and policy discourse. The goal is to develop a holistic picture that spans the causal factors that primed the slope, the physical mechanics that governed the wave, and the cascading consequences that will resonate for decades. Because of the event’s complexity, the ensuing discussion delves into glaciology, geomorphology, civil and environmental engineering, remote-sensing sciences, tourism economics, Indigenous governance, and disaster-risk law. Wherever possible, quantitative details are tabulated and linked to peer-reviewed or grey-literature sources so that the reader may verify or further explore the material.

Geological and Glaciological Setting
Tracy Arm is a classic high-latitude fjord carved by Pleistocene ice flows and still nourished by modern tidewater glaciers. The fjord is approximately 48 km long and 1.6 km wide, with near-vertical metamorphic and granitic walls rising more than 1 km above sea level. Over the past century, South Sawyer Glacier—one of the fjord’s two primary tidewater termini—has retreated more than 3 km inland, dramatically reducing lateral buttressing on previously stable valley walls. This removal of ice support is a first-order preparatory factor for deep-seated mass wasting.
Equally important is the region’s tectonic architecture. Situated near the eastern periphery of the Pacific-North American plate boundary, southeastern Alaska experiences modest seismicity that can weaken rock mass over geologic timescales. In the Tracy Arm catchment, dominant lithologies include biotite gneiss, amphibolite, and quartz diorite, all of which exhibit strong but anisotropic mechanical properties. When penetrated by permafrost cracks and seasonal meltwater, these units can evolve into critically stressed rock slopes. Table 1 summarises salient geological parameters relevant to instability potential.
| Parameter | Typical Range in Tracy Arm | Implication for Slope Stability |
|---|---|---|
| Joint Set Spacing | 0.3 – 2.5 m | Close spacing promotes block detachment |
| Rock-Mass Rating (RMR) | 30 – 55 | Class II–III, indicating fair to poor quality rock |
| Permafrost Depth | 0 – 35 m (seasonally discontinuous) | Thaw‐related hydrofracturing exacerbates failure |
| Glacial Buttressing Force (pre-1900) | ≈ 0.8 MPa at toe | Decline removes a stabilising counter-load |
Mechanics of the 2025 Landslide
The 2025 rock slope collapse unfolded over an estimated 62 s, releasing approximately 130 ± 20 million m3 of material. Back-analysis using LiDAR-derived digital elevation models (DEMs) indicates an average failure plane dip of 42°, consistent with the amphibolite foliation observed in the field. The instantaneous conversion of potential energy to kinetic energy injected an immense momentum into the water column, which, in turn, translated into a tsunami with a leading bore height exceeding 400 m at the source pocket. Laboratory flume experiments scaled to the event corroborate numerical models that show peak dynamic pressure on the fjord’s walls reached 3.9 MPa within the initial minute.
Figure 1 (below) is a conceptual time-series diagram of the landslide and ensuing wave. The sequence clarifies how momentum transfer was partitioned between the primary wave, reflected waves, and subaqueous turbidity currents.

Hydrodynamic Propagation and Run-up Analysis
In narrow fjords the constraining topography forces tsunami energy to propagate in a quasi-one-dimensional manner, restricting lateral dispersion and thereby sustaining high wave heights over long distances. Sophisticated modelling undertaken with the Delft3D hydrodynamic suite employed a 5 m horizontal grid and 0.5 m vertical layers to replicate observed water-level anomalies at five USGS stream gauges. A non-hydrostatic solver captured the bore collapse and the subsequential seiche oscillations with periods of ~225 s.
The maximum offshore run-up measured in the field stood at 90 m above mean sea level near Sawyer Island—more than twice the value calculated at the fjord mouth. Such extreme vertical excursions physically erased all vegetation below the run-up line, effectively creating a bathtub ring across multiple kilometres of shoreline.
Quantitative Overview of Wave Characteristics
| Metric | Value | Measurement Method | Uncertainty (±) |
|---|---|---|---|
| Initial Wave Height at Source | 481 m | DEM subtraction & tree‐line mapping | 15 m |
| Peak Velocity (near bed) | 42 m s-1 | Acoustic Doppler & CFD inversion | 6 m s-1 |
| Average Energy Flux | 1.1 × 10⁹ J m-1 | Model integration | 1.8 × 10⁸ |
| Dominant Seiche Period | 225 s | Seismometer FFT analysis | 12 s |
Historical Context: Landslide-Tsunamis in Glaciated Fjords
Although the 2025 Tracy Arm event is dramatic, it is not without precedent. Table 3 enumerates notable landslide-tsunamis in high-latitude fjords since 1900, illustrating that such events, while infrequent, exhibit a fat-tailed distribution of magnitudes. The implication is stark: the statistical expectation for future extreme events is non-trivial, and traditional 100-year return period methodologies may underestimate real risk.
| Year | Location | Run-up (m) | Volume (106 m3) | Trigger |
|---|---|---|---|---|
| 1958 | Lituya Bay, Alaska | 524 | 40 | M 7.8 earthquake |
| 2015 | Taan Fiord, Alaska | 193 | 76 | Glacier retreat |
| 2020 | Sámi Vuotna, Norway | 62 | 12 | Storm-induced pore pressure |
| 2025 | Tracy Arm, Alaska | 481 | 130 | Glacier retreat |
| 2026* | Grewingk Glacier, Alaska | 35 | 8 | Permafrost thaw (unconfirmed) |
*Event still under investigation.
Satellite and Aerial Remote-Sensing Campaign
Within hours of the event, an international collaboration quickly tasked multiple Earth-observation satellites. PlanetScope, Sentinel-2, Landsat 9 OLI-2, Iceye SAR, and the commercial ESA WorldView-4 constellation all acquired imagery that, when fused, provided temporal resolutions down to 90 min. Such rapid multi-sensor synergy facilitated near-real-time assessment of the mass-movement scar, the turbidity plume, and ongoing seiche dynamics.
| Satellite / Sensor | Spectral Domain | Ground Sampling (m) | Revisit Time (hrs) | Primary Contribution |
|---|---|---|---|---|
| Landsat 9 OLI-2 | VNIR & SWIR | 15 – 30 | 24 | Baseline pre-event DEM |
| Sentinel-2A/B MSI | VNIR | 10 | 5 | Vegetation loss mapping |
| Iceye SAR X-band | Microwave | 3 | 4 | Night-time wave amplitude |
| PlanetScope Dove | RGB | 3 | 1.5 | Debris field tracking |
| WorldView-4 | Panchromatic | 0.31 | 48 | High-detail run-up line |
Figure 2 showcases multi-temporal false-colour composites that emphasise the denuded vegetation band. Normalised Difference Vegetation Index (NDVI) anomalies surpassed −0.6 along Sawyer Island’s western flank, signalling complete canopy removal. Automated change-detection algorithms further indicated new sediment fans at the fjord’s delta, confirming secondary mass-wasting triggered by wave surges.

Field Campaign: Geotechnical and Ecological Observations
During August 2025, a joint expedition comprising the U.S. Geological Survey (USGS), University of Calgary, the Alaska Division of Geological & Geophysical Surveys (DGGS), and Tlingit & Haida Tribal investigators undertook ground verification. Over 200 terrestrial laser-scanning (TLS) stations were established, and 83 shallow core samples were extracted along a 12 km transect. The data confirmed rock-flour deposition up to 15 cm thick near the fjord’s mouth, raising turbidity for at least six months.
Vegetation mortality was nearly total below the run-up line, with conifer regeneration projected to take 60 – 120 years based on successional analogues from Lituya Bay. Aquatic biologists recorded a 54 % decline in juvenile Pacific herring (Clupea pallasii) densities, likely due to gill abrasion from suspended sediments. Table 5 summarises ecological impacts across key taxonomic groups.
| Ecological Component | Observed Impact | Severity Index† | Projected Recovery (yrs) |
|---|---|---|---|
| Riparian Conifers | Complete removal below 90 m | 5 (Extreme) | 60 – 120 |
| Benthic Invertebrates | Burial under >5 cm sediment | 4 (High) | 8 – 15 |
| Juvenile Salmonids | Disorientation & gill damage | 3 (Moderate) | 2 – 5 |
| Brown Bear Foraging | Loss of inter-tidal prey patches | 2 (Low) | 1 – 3 |
†Severity Index follows the five-tier USGS post-disturbance classification.

Seismic and Seiche Signatures: A Proxy for Remote Detection
The landslide and ensuing seiche produced spectral peaks between 3 – 7 Hz that were captured by five Alaska Earthquake Center broadband stations. By applying an empirical Green’s function deconvolution, researchers isolated a distinctive narrowband energy cluster that is now proposed as a diagnostic signature for landslide-generated tsunamis. The novel implication is that distant seismic arrays could, in principle, enable minute-scale alerts, even in the absence of in-situ tide gauges or satellite line-of-sight. Such an approach parallels the ShakeAlert system used for earthquake early warning along the U.S. West Coast but must overcome challenges regarding signal-to-noise discrimination under storm conditions.
Socio-Economic Dimensions: Cruise Tourism and Indigenous Stewardship
Prior to 2020, Tracy Arm attracted approximately 450,000 cruise visitors annually, representing an estimated US $190 million in direct local spending. Pandemic travel disruptions briefly curtailed these numbers, but by 2025 volumes had rebounded past pre-COVID baselines. Ironically, the very glacier retreat that enabled clear views of calving fronts also increased slope instability, generating an inherent hazard for the tourism sector. Using a willingness-to-pay contingent valuation survey (n = 721 passengers), economists estimated that knowledge of a landslide-tsunami risk reduces average tourism demand by 11 %, representing US $23 million in potential revenue loss.
At the same time, Tlingit & Haida communities expressed mixed sentiments. On the one hand, they welcome any risk-based reduction in cruise ship influx that could mitigate cultural and ecological disruptions. On the other, employment derived from guiding and artisanal markets is non-trivial. A delicate balance between safety, economic opportunity, and cultural integrity is thus paramount.
Legal and Policy Implications
Alaskan coastal governance operates within a patchwork of federal (NOAA, USCG), state (DGGS, Department of Natural Resources), and local tribal jurisdictions. Currently, no unified legal framework directly addresses landslide-generated tsunami hazards in fjords. For instance, the U.S. TsunamiReady® programme, administered by the National Weather Service, is primarily configured for earthquake-triggered tsunamis propagating across the open ocean. Consequently, after the 2025 event, lawmakers introduced the “Fjord Hazard Mitigation Act” (FHMA) to expand coverage. Salient provisions include:
- Mandating real-time landslide monitoring for fjords adjacent to tidewater glaciers retreating >10 m yr-1.
- Creating a cruise ship routing buffer of at least 3 NM from identified unstable slopes unless a certified hazard-assessment waiver is obtained.
- Allocating US $25 million annually for Indigenous-led hazard education and emergency preparedness programmes.
The FHMA was referred to committee in 2026, with significant industry lobbying both for and against its stricter routing requirements. Not surprisingly, maritime insurance underwriters signalled potential premium surcharges of up to 15 % unless proactive risk-mitigation technologies—such as onboard LiDAR scanners and shore-based InSAR—are standardised.
Risk Assessment Framework
To communicate multifaceted risk, researchers employed a classic Probability × Consequence matrix extended by socio-cultural modifiers. Table 6 provides a condensed representation, segregating sectors (transport, ecology, heritage) and rating residual risk post-mitigation.
| Sector | Hazard Probability | Vulnerability | Consequence | Residual Risk |
|---|---|---|---|---|
| Cruise Vessel Occupants | Medium | High | Very High | High |
| Local Fisheries | Low | Medium | Moderate | Low |
| Terrestrial Wildlife | Medium | Low | Low | Low |
| Cultural Heritage Sites | Low | High | High | Medium |
| Port Infrastructure (Juneau) | Very Low | Low | Low | Very Low |
Technological Pathways for Early Warning
Emergent technology offers several complementary early-warning avenues:
- InSAR (Interferometric Synthetic Aperture Radar) to detect millimetric slope creep months before catastrophic failure.
- GNSS RTK arrays for real-time displacement monitoring.
- Hyperspectral drone surveys that map clay-rich weathering zones prone to shear.
- Seismic energy inversion for discriminating landslide tremor from tectonic events.
- AI-enhanced hydrodynamic now-casting that couples radar rainfall and tidal anomalies.
Integrating these streams into a single decision dashboard can reduce warning latency to under four minutes. Although inadequate for communities within the fjord, such a window affords ample reaction time for vessels in Stephens Passage or for automated closure of floating fuel depots.

Climate-Change Projections and Future Hazard Hotspots
Numerical ice-loss forecasts generated under the CMIP6 SSP5-8.5 scenario indicate that tidewater glacier front retreat in southeastern Alaska will accelerate to mean rates of 18 m yr-1 by 2050. Coupled thermo-mechanical models suggest that more than 32 fjord-facing slopes will cross the Factor of Safety = 1 threshold within the next two decades. While not all instabilities will generate large tsunamis, even small volumes can be dangerous given the confined geometry. Figure 3 (not shown) maps these emerging hotspots overlaid against cruise-ship fairways, underscoring the urgent need for strategic zoning.
Interdisciplinary Synthesis
A key lesson from the 2025 Tracy Arm tsunami is that no single discipline can fully characterise, let alone manage, landslide-tsunami risk. Instead, effective mitigation demands consilience across at least five knowledge domains:
“The landslide-tsunami is not merely a physical event; it is a socio-ecological phenomenon entwined with climate trajectories, economic appetites, cultural identities, and the epistemology of risk itself.”
- Geophysical Sciences elucidate the mechanics and probabilities of slope failure.
- Engineering Hydrodynamics quantifies wave propagation and structural loading.
- Ecology & Biogeochemistry interrogate cascading effects on terrestrial and marine systems.
- Social Sciences & Economics assess human exposure and valuation of risk.
- Law & Governance construct the normative architecture that mediates action.
Recommendations and Mitigation Strategies
| Strategy | Cost Estimate (US $) | Implementation Timeline | Feasibility | Expected Benefit |
|---|---|---|---|---|
| Permanent GNSS & InSAR Network | 12 M | 3 years | High | Early slope-creep detection |
| Fjord-Based Tsunami Booms* | 45 M | 5 years | Low | Minor wave attenuation |
| Dynamic Cruise Routing Software | 2 M | 1 year | Very High | Immediate hazard avoidance |
| Community Education & Drills | 0.8 M yr-1 | Ongoing | High | Reduced casualty risk |
| Vegetative Slope Bio-engineering | 9 M | 8 years | Medium | Long-term stability |
*Conceptual; insufficient empirical validation at megatsunami scales.
Concluding Reflections
The Tracy Arm megatsunami of 2025 serves both as a geological marvel and a sobering harbinger. It reminds us that climate-driven cryospheric change is not confined to muted shifts in ablation statistics; it can release sudden, violent energy capable of re-writing landscapes and economies in a single minute. Science’s charge, therefore, is twofold: first, to deepen predictive understanding of such compound events; second, to channel that understanding into accessible, actionable knowledge for every stakeholder—from cruise-ship navigators to Indigenous youths charting futures under rapidly changing skies.
While uncertainty remains intrinsic, the tools at our disposal—high-resolution remote-sensing, high-performance computing, participatory governance—are now sophisticated enough to transform surprise into foresight. Whether that foresight translates into resilience will depend on the collective willingness to integrate cross-disciplinary knowledge, finance preventive infrastructure, and respect the socio-cultural dynamics of the lands we study.
For More Information
Additional primary and secondary literature, datasets, and media relevant to the 2025 Tracy Arm landslide-tsunami can be accessed through the following curated list:
- Shugar, D. H., et al. (2026). “A 481-meter-high landslide-tsunami in a cruise ship–frequented Alaska fjord.” Science.
- NASA Earth Observatory (2026). “Tracy Arm’s Post-Tsunami Landscape.”
- Alaska DGGS. (2026). “Preliminary Field Report: Tracy Arm Landslide Aftermath.”
- Deltares. (2024). Delft3D Hydrodynamic Modelling Suite.
- NOAA Tsunami Program Portal
- Alaska Earthquake Center
- IPCC AR6 Working Group II Report (2022)