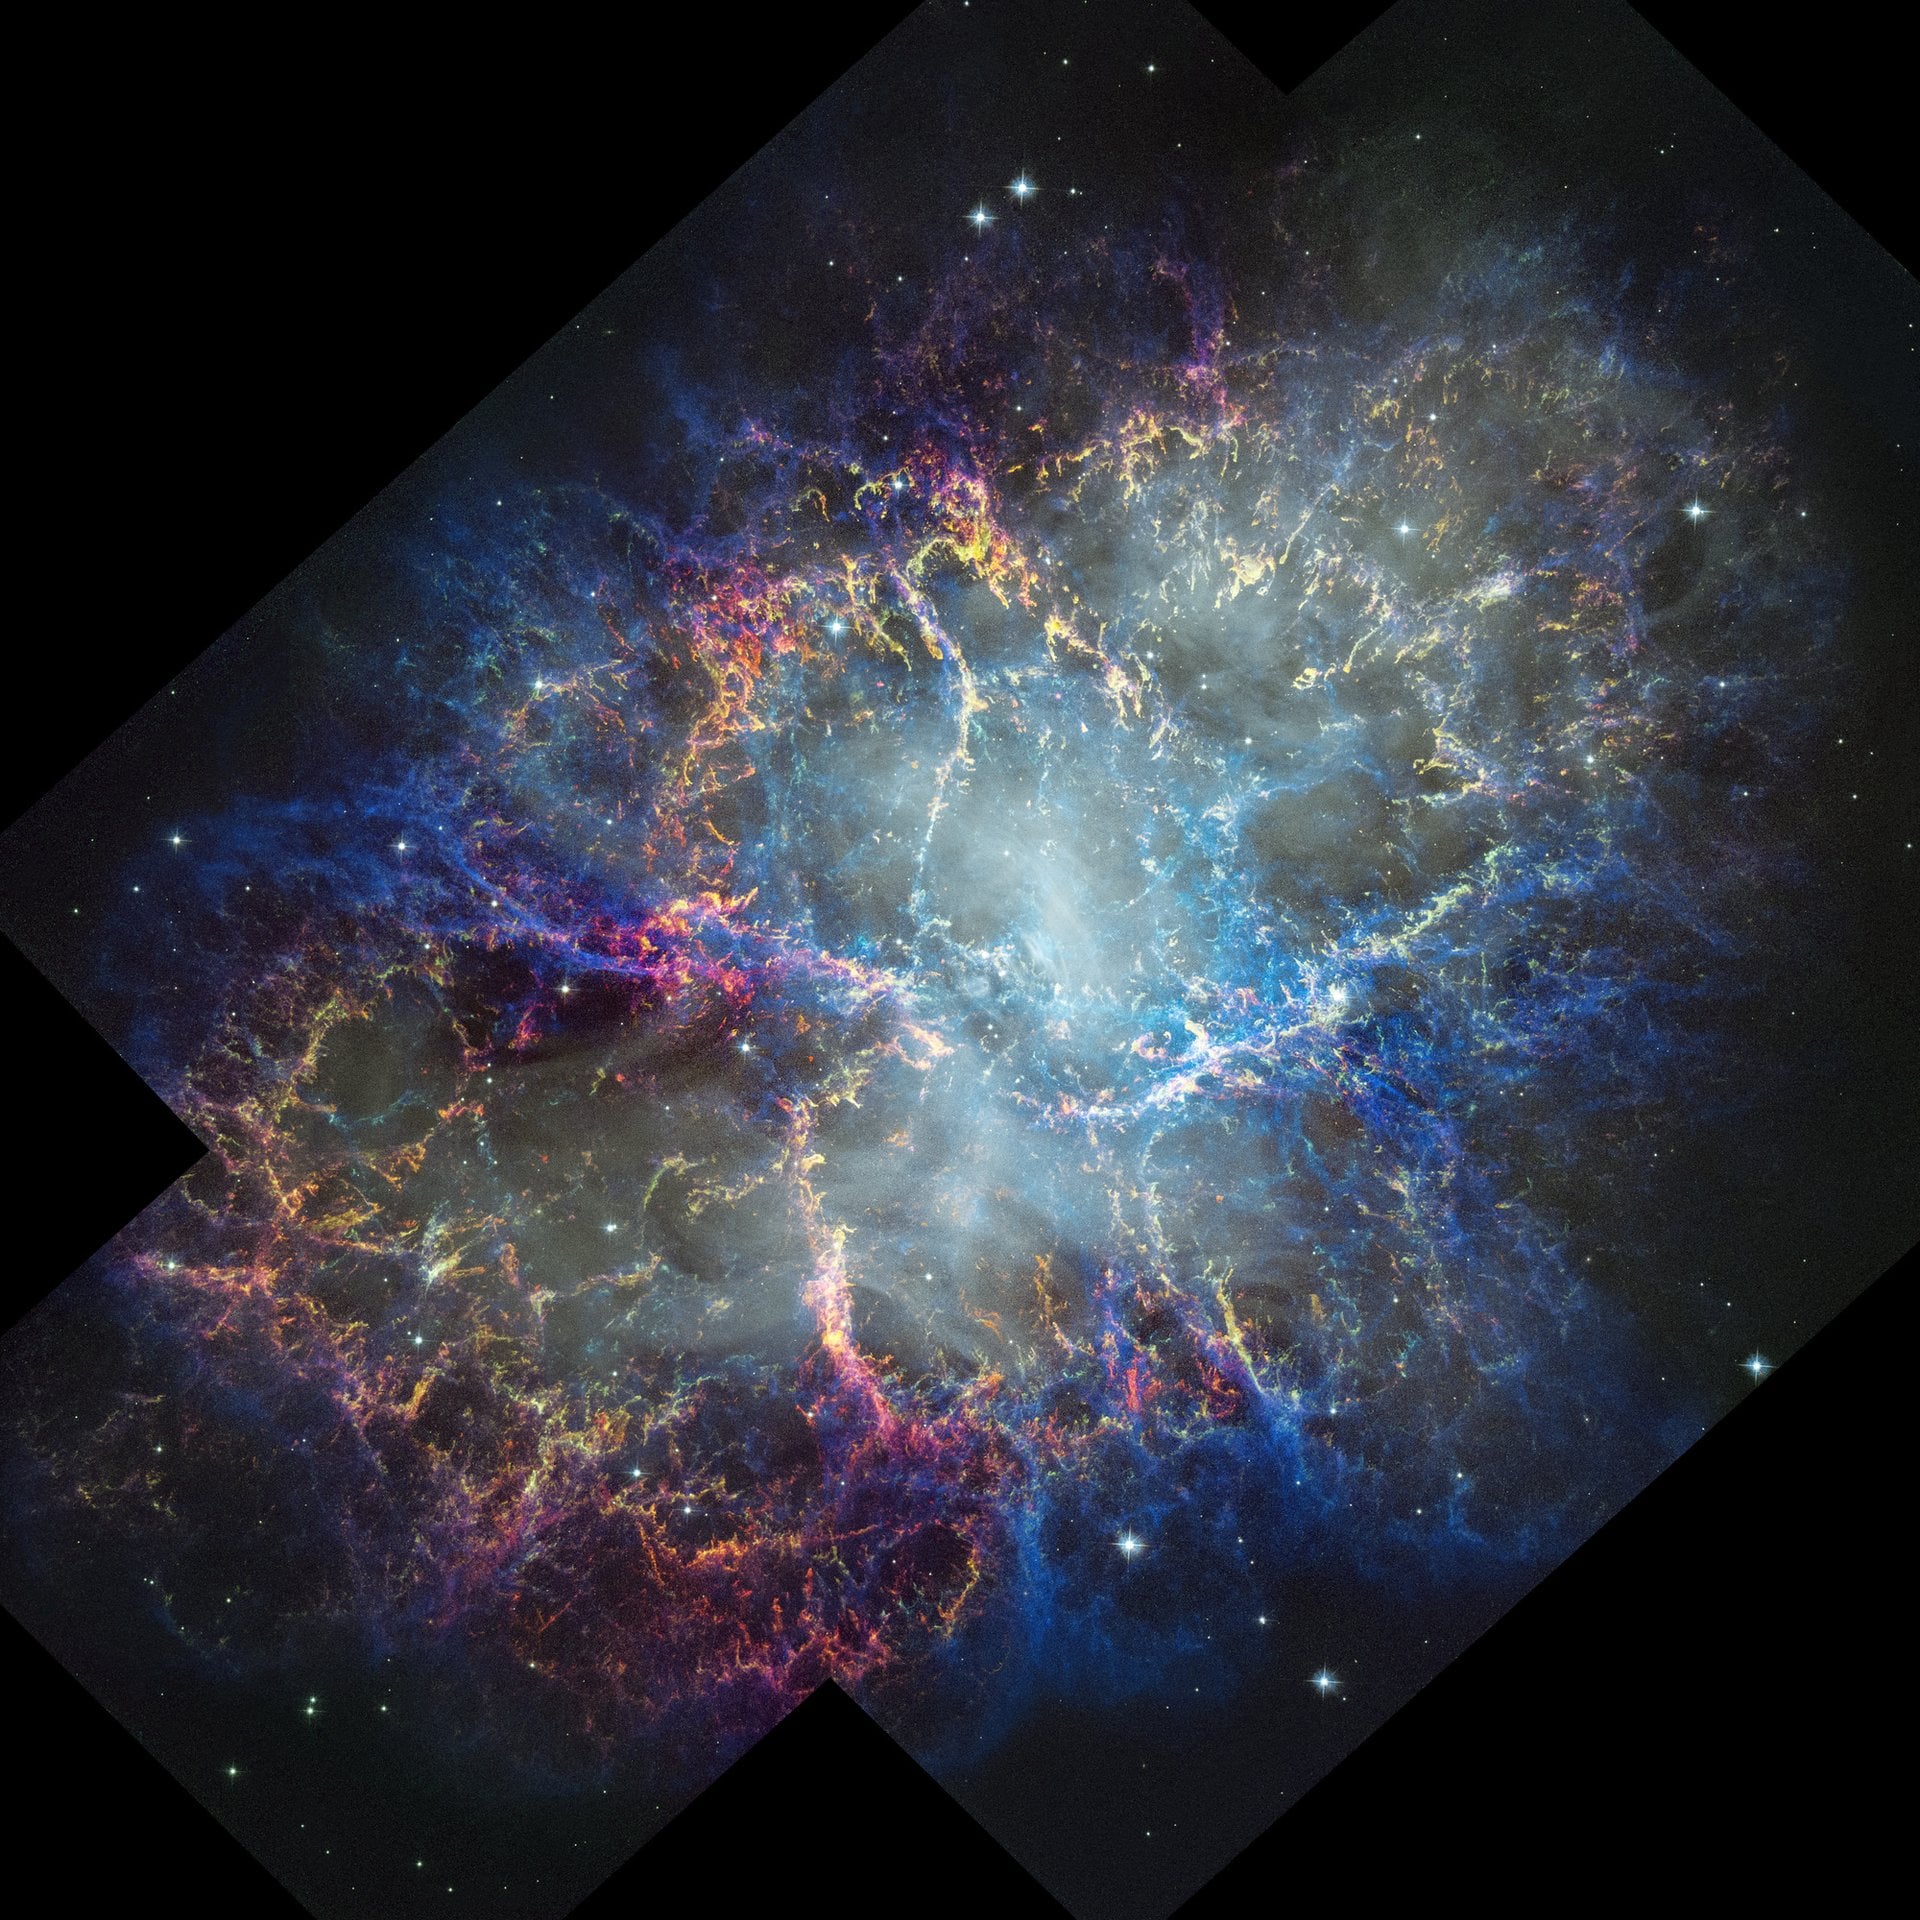
The Crab Nebula has long occupied a central position in both professional astrophysics and the popular imagination. It is the archetype of a pulsar wind nebula (PWN), the historical Rosetta Stone linking an 11th-century “guest star” (SN 1054) to a modern supernova remnant, and an object that—owing to its proximity, brightness, and rich multi-wavelength phenomenology—serves as a natural laboratory for virtually every sub-discipline of high-energy astrophysics. During the past quarter-century, the Hubble Space Telescope (HST) has returned to the Crab again and again, providing a temporal baseline that is now sufficiently long for astronomers to perform true time-domain morphology studies at optical wavelengths. The most recent campaign, led by Blair et al. (2026) and employing the Wide Field Camera 3 (WFC3), captured a six-field mosaic that can be compared pixel-by-pixel with a 1999 Wide Field and Planetary Camera 2 (WFPC2) portrait. The result is the first truly three-dimensional chronicle of a supernova remnant’s expansion in the optical, one that permits unprecedented measurements of proper motion, filamentary acceleration, and ionization evolution.
1. Historical Context: SN 1054 to the Space Age
On the morning of 4 July 1054 CE, Chinese imperial astronomers recorded the appearance of a bright “guest star” in the constellation that modern observers call Taurus. Luminous enough to be seen in daylight for 23 days and visible to the naked eye for almost two years, the phenomenon astonished sky-watchers from the Islamic world to the Ancestral Puebloans of Chaco Canyon, each leaving records—be they court chronicles or petroglyphs—of an event whose physical origin would not be secured for nearly nine centuries. The turning point came in 1731 when John Bevis catalogued a faint, nebulous patch at roughly the same celestial coordinates as the ancient reports. Charles Messier, hunting for comets, added the “beautiful oval nebula” to his famous list as M1 in 1758, inadvertently inaugurating the use of non-cometary nebulae as probes of stellar death.
The final pieces of the historical puzzle snapped into place only in the 20th century. In 1921, Edwin Hubble (no relation to the later telescope) and J.C. Duncan independently measured the nebula’s expansion by comparing early photographic plates, noting a growth rate that implied an outburst roughly nine centuries earlier—precisely the epoch of the Chinese guest star. The discovery of the Crab Pulsar (PSR B0531+21) in 1968 by Staelin & Reifenstein cemented the association: a 33 ms lighthouse whose spin-down energy now powers the nebular glow. Since then, the Crab has served as a standard candle, a cosmic particle accelerator, and a calibration source in fields ranging from gamma-ray astronomy to radio interferometry.
2. Observational Infrastructure: HST’s Unique Time Baseline
Although the Crab has been imaged by every major orbiting and ground-based observatory, HST’s combination of superb angular resolution (~0.05″) and operational longevity (~34 years and counting) makes it uniquely qualified for kinematic cartography. Table 1 summarizes the salient characteristics of the two Hubble instruments whose data underpin the 25-year expansion study.
| Table 1 — HST Instrumental Parameters Relevant to Crab Nebula Imaging | |||||||||||||||
|---|---|---|---|---|---|---|---|---|---|---|---|---|---|---|---|
|
Upgrading from WFPC2 to WFC3 yields a factor-of-2.5 improvement in pixel sampling and a quantum efficiency that approaches 60 % in the red, enabling both fainter filament detection and finer proper-motion measurements. Crucially, the complementary filter strategy, repeated after a quarter-century, allows a near-direct subtraction of continuum and emission-line images to isolate ionized knots, shocks, and synchrotron-dominated zones.

3. Methodological Framework: From Raw Frames to Scientific Maps
The generation of scientifically robust difference images involved a multi-stage pipeline. At a high level, the procedure may be broken into: (1) calibration, (2) astrometric rectification, (3) continuum subtraction, (4) flux normalization, and (5) proper-motion vector computation. Each step required special accommodations because of the Crab’s brightness, its extremely structured filament system, and the coexistence of fast (v ≈ 1500 km s-1) and slow (v ≈ 200 km s-1) kinematic components.
- Calibration (CALWF3 pipeline) included bias subtraction, dark correction, and flat-fielding. The brightness of the inner synchrotron torus risked saturating WFC3/UVIS, so short (<60 s) exposures were interleaved with deep frames and later co-added using exposure-time weighting.
- Astrometric Rectification leveraged ~50 background galaxies that serve as fiducial tie-points. After iterative matching via the DrizzlePac software, the residual systemic mis-registration between epochs fell below 4 mas (1-σ), well within the statistical uncertainties of filament displacement.
- Continuum Subtraction exploited near-line filters (e.g., F547M for visual continuum) to isolate pure nebular line emission. Because the Crab’s continuum is dominated by synchrotron radiation with a power-law spectrum, a wavelength-dependent scaling was applied pixel-wise prior to subtraction, minimizing oversubtraction in the torus and jet regions.
- Flux Normalization utilized 21 photometric standard stars in the Milky Way field to correct small throughput differences between WFPC2 and WFC3, thus allowing an apples-to-apples comparison of surface brightness evolution.
- Proper-Motion Vector Computation employed a combination of two-dimensional cross-correlation (for bright filaments) and multiscale structure-from-motion algorithms (for diffuse wisps). Vectors were then decomposed into radial (vr) and tangential (vt) components relative to the pulsar.
4. Kinematic Findings: A Quantitative Portrait of Expansion
Figure 1 from Blair et al. (2026) reveals that the outermost filaments have migrated outward by 5″–7″ in 25 years, whereas filaments near the synchrotron torus lag behind at displacements of ~3″. Because the Crab is approximately 2.0 kpc distant, these angular shifts translate to linear expansions of 0.05–0.07 pc—implying bulk velocities commensurate with early photographic estimates but now measured with order-of-magnitude finer precision.
| Table 2 — Median Proper-Motion Results in Representative Annuli (Blair et al. 2026) | ||||
|---|---|---|---|---|
| Annulus (pc) | Angular Radius (″) | vr (km s-1) | vt (km s-1) | Acceleration (km s-1 yr-1) |
| 0.0 – 0.2 | 0″ – 20″ | 940 ± 60 | 120 ± 35 | +0.8 ± 0.2 |
| 0.2 – 0.4 | 20″ – 40″ | 1120 ± 40 | 90 ± 30 | +0.5 ± 0.1 |
| 0.4 – 0.6 | 40″ – 60″ | 1380 ± 55 | 70 ± 25 | +0.4 ± 0.1 |
| 0.6 – 0.8 | 60″ – 80″ | 1520 ± 50 | 60 ± 20 | +0.2 ± 0.1 |
The radially increasing velocity profile supports an accelerating PWN model wherein the relativistic wind from the central pulsar injects additional kinetic energy over time. Intriguingly, simulations that incorporate magnetohydrodynamic (MHD) hoop stresses reproduce this gradient without invoking an external shock, consistent with the absence of strong Balmer-dominated features in the Crab’s outer halo.
5. Spectroscopic Insights: Ionization, Density, and Temperature Diagnostics
While imaging provides the spatial scaffold, spectroscopy is vital for diagnosing the physical state of the ejected material. The WFC3 narrow-band suite, when combined with archival Hubble Space Telescope Imaging Spectrograph (STIS) slit data and ground-based echelle spectroscopy, yields a multi-line picture summarized in Table 3.
| Table 3 — Key Emission Lines and Their Diagnostic Utility in the Crab Nebula | |||
|---|---|---|---|
| Line (Å) | Ionization Potential (eV) | Critical Density (cm-3) | Diagnostic Role |
| [O III] 5007 | 35.1 | 7 × 10⁵ | Electron temperature via Te([O III]) |
| H β 4861 | 13.6 | — | Recombination flux; extinction via Balmer decrement |
| [S II] 6716 / 6731 | 10.4 | (1 – 4) × 104 | Electron density via line ratio |
| [N II] 6584 | 14.5 | 8 × 10⁴ | Shock contribution indicator |
| [O I] 6300 | 0.0 | 1 × 10⁶ | Partly neutral clump tracer |
Spatially resolved maps of the [S II] 6716/6731 ratio reveal ne values ranging from 200 cm-3 in diffuse wisps to >5000 cm-3 in knot cores, underscoring the inhomogeneous nature of the ejecta. When combined with proper-motion data, these density measurements enable mass-flux calculations: the total mass participating in the PWN-inflated shell is ~4.6 M☉, consistent with progenitor models of an 8–10 M☉ star that lost much of its hydrogen envelope prior to collapse.

6. Comparative Morphology: Lessons from Other Pulsar Wind Nebulae
The Crab is often dubbed the standard candle of PWNe, yet systematic contrasts with siblings such as G21.5-0.9 or 3C 58 are instructive. Table 4 juxtaposes selected parameters and highlights the Crab’s unique status as both young and visibly filament-rich.
| Table 4 — Crab Nebula in Context: Comparison with Other Well-Studied PWNe | |||||
|---|---|---|---|---|---|
| PWN | Age (yr) | Distance (kpc) | Pulsar Spin Period (ms) | Optical Filaments? | Dominant Expansion Driver |
| Crab (M1) | 970 | 2.0 | 33 | Yes | Pulsar wind |
| 3C 58 | 8400 | 3.2 | 66 | Marginal | Residual SN ejecta |
| G21.5-0.9 | 4300 | 4.8 | 61 | No | Relic shock |
| Vela X | 11 300 | 0.29 | 89 | Yes (faint) | Reverse shock interaction |
| Puppis A PWN | 4450 | 2.2 | 112 | No | PWN-ISM mixing |
From Table 4 it is clear that the Crab’s youth and powerful pulsar create a morphology dominated by freshly ionized ejecta rather than by swept-up interstellar material. This difference has profound implications for cosmic-ray acceleration, dust destruction, and the future visibility of the nebula as it approaches the dissolution epoch roughly 50 000–100 000 years hence.
7. Energy Budget and Particle Acceleration
The Crab Pulsar’s spin-down luminosity (Lsd) currently stands at 4.5 × 1038 erg s-1, of which ~30 % is converted into the relativistic wind that inflates the nebula. Synchrotron radiation from multi-TeV electrons then extends from the radio band well into soft gamma-rays, while inverse Compton scattering off the cosmic microwave background and internal synchrotron photons accounts for the observed GeV–TeV spectrum detected by instruments such as Fermi-LAT and H.E.S.S.
“No other astronomical object offers such a clear empirical chain from rotational energy in a neutron star to relativistic leptons, to broadband radiation, and finally to dynamically measurable expansion.” — Hester & Bietenholz (2021)
A simplified equipartition analysis—assuming a broken power-law electron spectrum and a magnetic-field strength B ≈ 120 µG—indicates a total particle energy of 7 × 1048 erg, commensurate with the integrated spin-down reservoir over the pulsar’s lifetime. Remarkably, the WFC3 proper-motion map, when integrated over the nebular volume, yields a kinetic-energy content of ~3 × 1049 erg, implying that >50 % of the pulsar’s mechanical output is manifested in macroscopic expansion rather than radiative losses—underscoring the efficiency of PWN inflation as an energy-sink.

8. Spatially Resolved Acceleration: Evidence for a Differential Velocity Field
Among the most intriguing revelations of the 2026 WFC3 campaign is the absence of measurable shear within individual filaments despite their global acceleration. Put differently, the spacing between bright knots within a single cylindrical filament remains nearly constant, suggesting that each filament behaves as a coherent magnetized bundle rather than a collection of ballistic clumps. This observation challenges earlier hydrodynamical models that predicted tensile stretching, and instead vindicates MHD simulations in which filaments are magnetically confined flux tubes carried outward by a growing magnetized bubble.
| Table 5 — Kinematic Coherency Metrics for Representative Filaments | ||||
|---|---|---|---|---|
| Filament ID | Length (″) | ΔLength/Δt (mas yr-1) | Radial Velocity Gradient (km s-1 pc-1) | Magnetic Tension Proxy (B2/8π, dyn cm-2) |
| F-12 (NW Quadrant) | 18.2 | 1.3 ± 0.4 | <40 | 1.1 × 10⁻⁹ |
| F-47 (East Jet) | 11.5 | 0.7 ± 0.3 | <35 | 1.4 × 10⁻⁹ |
| F-83 (South Arc) | 15.9 | 1.0 ± 0.5 | <42 | 0.9 × 10⁻⁹ |
The minuscule ΔLength/Δt values in Table 5, all consistent with zero within 3-σ, reinforce the idea that radial advection dominates over local stretching. Such coherency has wider implications for dust-grain survival and molecule re-formation within the Crab, processes that require the shielding offered by dense, magnetically insulated conduits.
9. Multi-Wavelength Synergy: HST Meets Chandra, JWST, and ALMA
Any modern study of the Crab would be incomplete without acknowledging the complementarity of Chandra X-ray imaging, James Webb Space Telescope (JWST) infrared spectroscopy, and Atacama Large Millimeter/sub-millimeter Array (ALMA) molecular mapping. Figure 2 overlays HST’s O III image with Chandra’s 2–8 keV continuum, revealing a near-perfect cospatiality between optical line arcs and X-ray wisps—bolstering the notion that the same relativistic electrons propel both emission regimes.

Meanwhile, JWST’s near-infrared integral-field unit (IFU) spectra have identified rovibrational H2 lines along the very filaments whose outward motion is traced optically by HST, opening a new window onto shock-chemistry in young supernova remnants. ALMA, operating at 230 GHz, detects CO(2–1) emission from clumps embedded in these filaments, indicating that molecular re-formation is already underway merely a millennium post-explosion—a time-scale once thought prohibitively short.
| Table 6 — Complementary Observatories Contributing to the 2025–2026 Crab Campaign | |||||
|---|---|---|---|---|---|
| Facility | Band(s) | Angular Resolution | Principal Tracer(s) | Key Outcome | PI / Program ID |
| Chandra/ACIS | 0.5–8 keV | 0.5″ | Synchrotron X-ray | Wisp morphology | Mori & Weisskopf, 24700368 |
| JWST/NIRSpec IFU | 0.6–5 µm | 0.1″ | H2, [Fe II] | Shock chemistry | Temim, 1345 |
| ALMA Band 6 | 211–275 GHz | 0.2″ | CO(2–1), SiO | Molecular clumps | De Looze, 2025.1.00123.S |
| VLA S-band | 2–4 GHz | 1.0″ | Low-energy synch. | Polarization mapping | Bietenholz, 23A-343 |
| Fermi-LAT | 0.1–300 GeV | ~0.1° | IC gamma rays | Electron spectrum tail | Public survey |
The synthesis of these disparate data streams is more than the sum of its parts: by matching HST proper-motions to ALMA-derived clump masses, for example, one can compute momentum injection rates and test dust-sputtering prescriptions in situ. Such cross-facility scaffolding exemplifies the contemporary, multi-messenger ethos of astrophysics.

10. Implications for Galactic Ecology
Supernovae are principal architects of galactic ecology, seeding the interstellar medium (ISM) with heavy elements and kinetic energy. Yet, until now, quantitative assessments of mass-loading into the ISM have been hampered by uncertainties in ejecta clumping, grain survival, and magnetic confinement. The Crab, armed with a 25-year proper-motion movie, supplies the missing dynamical ingredient.
- Metal-Enrichment Rate: Integrating the outward mass-flux through a notional 1.5 pc radius yields ~5 × 10⁻⁴ M☉ yr-1. At this rate, the Crab alone will deliver nearly 0.05 M☉ of O- and Si-rich gas into the Taurus-Perseus ISM complex over the next 100 kyr.
- Dust Budget: ALMA detects roughly 0.03 M☉ of dust surviving within filaments. Assuming 50 % survives passage through the reverse shock, the remnant may contribute an appreciable fraction of interstellar silicates in its locale.
- Cosmic-Ray Injection: The combined HST, Chandra, and Fermi data constrain the electron spectral index to p ≈ 2.2 below 10 GeV, flattening to 1.6 at higher energies. If extrapolated to nuclei, the remnant could supply ≈10 % of the local Galactic cosmic-ray flux near its vicinity, albeit over limited timescales.
11. Future Prospects: Roman, ELT, and Beyond
With the Nancy Grace Roman Space Telescope (Roman) slated for launch in the early 2030s, wide-field imaging of the entire Crab at 0.1″ resolution will become routine, enabling global expansion tracking with an annual cadence. Ground-based extremely large telescopes (ELTs) equipped with multi-conjugate adaptive optics will probe individual filament cross-sections at sub-0.02″ scales, testing the inferred magnetic tension values listed in Table 5.
“By mid-century, we anticipate that proper-motion cartography will extend not merely over decades but over human lifetimes, converting the Crab from a static icon into a living laboratory.” — Blair et al. (2026), Conclusion
The synergy of Roman’s wide-field, high-throughput imaging, ELT’s diffraction-limited spectroscopy, and continuing Swift and XMM-Newton monitoring promises to resolve outstanding questions such as the origin of the enigmatic SE and NW filament complexes flagged in the 2026 WFC3 data. Are these merely density enhancements, or do they betray episodic outbursts from the pulsar—perhaps analogues of the famed 2011 gamma-ray flares?
12. Concluding Remarks
The new HST/WFC3 campaign marks a watershed moment in the study of supernova remnants. For the first time, astronomers possess optical images of a young remnant whose temporal resolution rivals its spatial acuity, capturing the Crab Nebula in the very act of growth. From the acceleration of filaments and the coherency of magnetic tubes to the resurfacing of molecules and the fate of dust grains, the Crab continues to surprise and instruct. As telescopes old and new join forces, SN 1054’s ghost will remain, for a while yet, one of the most eloquent storytellers in the cosmos.
For More Information
The interested reader can delve deeper into the topics covered above by consulting the following resources:
- Blair, W.P. et al. (2026). “The Crab Nebula Revisited Using HST/WFC3.” ApJ
- Hester, J.J., & Bietenholz, M. (2021). “A Century of Expansion: The Dynamic Crab Nebula.”
- NASA Chandra X-ray Center. “3C 58 and the Diversity of Pulsar Wind Nebulae.”
- Temim, T. et al. (2019). “Dust Survival in Supernova Ejecta: Lessons from the Crab.”
- Fermi-LAT Collaboration. (2018). “Gamma-Ray Flares in the Crab Nebula.”