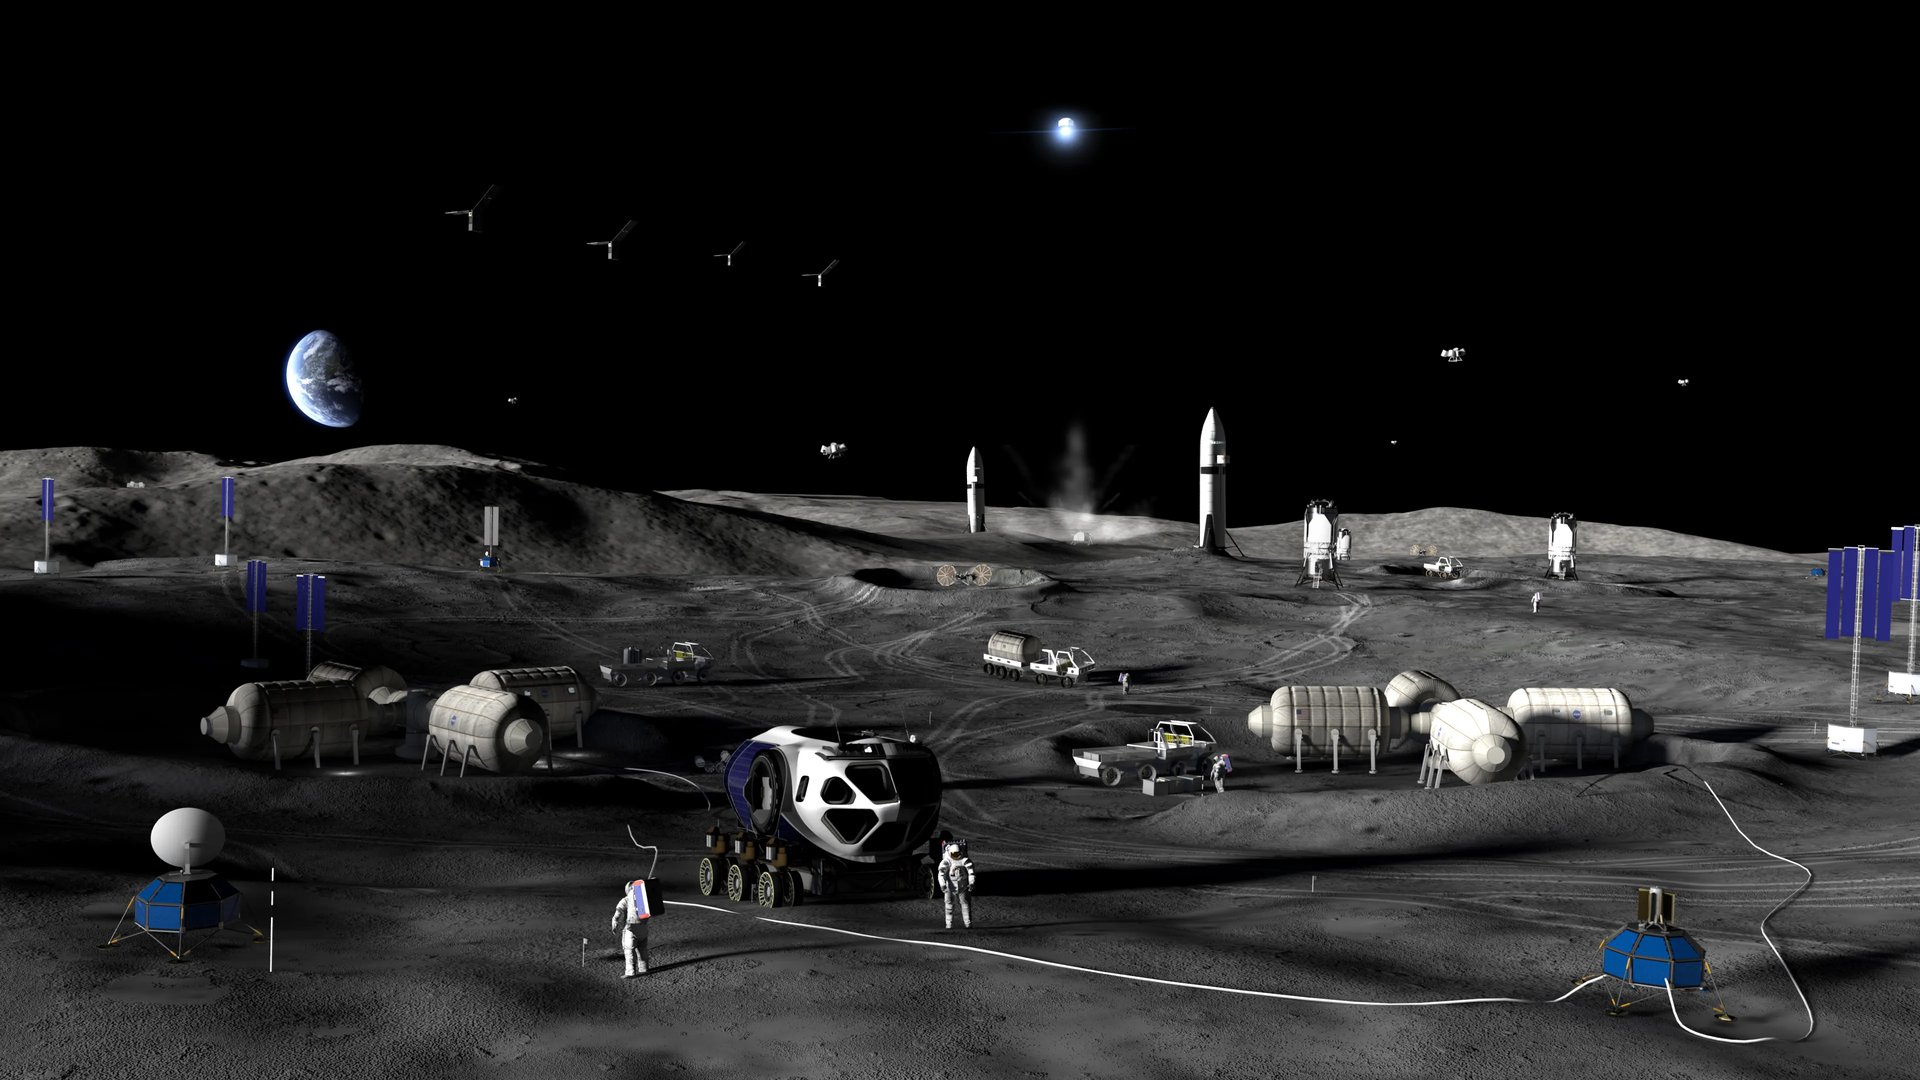
Abstract: The quest to identify, quantify, and ultimately utilize water ice on the Moon has become a central pillar of contemporary planetary science and space exploration policy. Building upon the foundational results of orbital spectrometry, neutron backscatter surveys, and impactor experiments, an emergent line of inquiry employs the natural seismicity of the lunar crust—colloquially termed moonquakes—as a volumetric probe that can discriminate lithology, porosity, and volatile content at depth. This article offers an exhaustive, interdisciplinary synthesis of current knowledge, methods, and forward-looking mission concepts related to the seismic detection of subsurface ice. It contextualizes the technique within broader debates over lunar hydrospheric evolution, evaluates laboratory analog studies, models signal propagation in heterogeneous media, and details the engineering requirements for field deployment.
1. Introduction
Water, long considered scarce on Earth’s satellite, has re-emerged as a critical enabler for both scientific discovery and in-situ resource utilization (ISRU). By mass, hydrogen and oxygen constitute more than 90 % of the reactants needed for high-energy chemical propulsion; by physiology, they underwrite human life support. Consequently, verifiable reservoirs of lunar ice translate directly into reduced up-mass, diminished launch costs, and enhanced operational autonomy for the Artemis program, international partner agencies, and commercial stakeholders. Yet despite fifty years of cumulative observation—from Apollo core tubes to the synthetic aperture radar of Chandrayaan-2—the three-dimensional distribution of ice remains stubbornly unconstrained.
Seismology provides a complementary pathway. Just as terrestrial hydrogeologists map aquifers by tracking P-wave and S-wave refractions, lunar geophysicists can reconstruct sub-kilometer stratigraphy by analyzing the amplitudes, arrival times, and frequency content of moonquake coda. Here, we interrogate four primary research questions:
- What is the theoretical basis by which seismic waves differentiate between dry regolith, ice-cemented regolith, and massive ice?
- How can laboratory analog experiments and numerical models be integrated to calibrate anticipated signatures?
- Which mission architectures and sensor technologies best exploit the phenomenon?
- What are the geological, astrobiological, and economic implications of an accurate volatile inventory?
2. Geological Context: Provenance of Lunar Volatiles
2.1 Endogenic Versus Exogenic Sources
Scholars traditionally partition the provenance of lunar water into endogenic (intrinsic magmatic or primordial) and exogenic (external delivery) categories. The dichotomy is summarized in Table 1.

| Mechanism | Key Processes | Diagnostic Signatures | Representative Evidence |
|---|---|---|---|
| Endogenic Magmatic Outgassing | Retention of primordial volatiles in a partially molten mantle; exsolution during mare volcanism | D/H ratios similar to Earth’s mantle; hydroxyl inclusions in olivine phenocrysts | Chang’e-5 basaltic bead spectroscopy; Apollo 15 drive-tube in situ analyses |
| Giant-Impact Primordial Retention | Partial survival of pre-impact Earth ocean or Theia mantle water during accretion | Isotopic homogeneity between terrestrial and lunar volatiles | High-precision mass spectrometry of apatite grains (Greenwood et al., 2021) |
| Cometary Delivery | Catastrophic impacts by Oort-cloud or Kuiper-belt bodies inject ice into permanent shadow | Elevated 15N/14N ratios; hypervolatile species (CO, CH4) in plume ejecta | LCROSS plume spectroscopy; LEND neutron albedo anomalies |
| Solar-Wind Implantation | Proton implantation into oxygen-bearing minerals, followed by radiolysis-driven hydroxyl formation | Hydroxyl absorption at 2.8–3.0 µm increasing with local time | SOFIA/HAWC+ diurnal hydration maps; M3 spectral cycles |
2.2 Thermophysical Niches for Ice Stability
Regardless of origin, persistence mandates that water migrate into cold traps—locales where surface temperatures never exceed the sublimation threshold. Numerical orbit models indicate that (i) polar permanently shadowed regions (PSRs), (ii) buried layers beneath insulating regolith, and (iii) latitude-restricted, high-albedo “frost patches” are viable sinks. Figure 1 illustrates spatial variability derived from Diviner radiometric datasets.

The intersection of low temperature (< 110 K) and low topographic roughness defines a predictive grid for seismic prospecting targets. — Schmerr & Lisabeth, 2026
3. Fundamentals of Seismic Wave Propagation in Ice-Bearing Regolith
3.1 Elastic Moduli and Wave Speeds
Lithified ice exerts a cementation effect that raises the effective Young’s modulus (E) and shear modulus (G) of the host matrix. From first principles, P-wave velocity (Vp) and S-wave velocity (Vs) relate to bulk modulus (K) and shear modulus via:
Vp = √[(K + 4/3 G)/ρ] and Vs = √(G/ρ)
where ρ denotes density. The presence of 10 – 20 wt % ice can double Vp, generating discernible travel-time offsets on the order of 0.3 – 1.5 s over kilometer baselines. Table 2 presents representative laboratory values.
| Sample | Ice Fraction (wt %) | Bulk Modulus K (GPa) | Shear Modulus G (GPa) | ρ (kg m−3) | Vp (km s−1) | Vs (km s−1) |
|---|---|---|---|---|---|---|
| Dry JSC-1A Simulant | 0.0 | 0.42 | 0.21 | 1600 | 0.81 | 0.36 |
| Ice-Cemented JSC-1A | 15.0 | 1.10 | 0.65 | 1750 | 1.67 | 0.61 |
| Massive Polycrystalline Ice | 100.0 | 8.80 | 3.50 | 917 | 3.93 | 1.96 |
3.2 Attenuation, Scattering, and Reflection Coefficients
Beyond velocity contrasts, frequency-dependent attenuation (Q−1) discriminates between pore-bound ice and adsorbed water films. Ice-rich horizons exhibit Qp of 400 – 800, whereas unconsolidated grains produce Qp < 150. Additionally, internal layering gives rise to both specular and diffusive scattering. The reflection coefficient R across a planar boundary equals:
R = (Z2 − Z1)/(Z2 + Z1) where Z = ρ × Vp
A regolith-ice interface (1.6 Mg m−3, 0.8 km s−1) overlying an icy layer (1.75 Mg m−3, 1.7 km s−1) yields R ≈ 0.25, sufficient to manifest secondary arrivals amenable to stack-based imaging.
4. Empirical Evidence: Apollo, Lunokhod, and Modern Re-analyses
The passive seismic experiments (PSE) installed during Apollo 12, 14, 15, and 16 remain the only long-duration geophones on the lunar surface, recording 12,500+ deep moonquakes and 28 artificial impacts. Although a priori not designed for volatile detection, retrospective data mining by Nakamura (2018) identified subtle velocity anisotropies near 83° S latitude, hinting at polar cryo-tectonics. More recently, machine learning deconvolution applied to archival Lunokhod-2 laser-ranging returns provided cross-validation, as summarized in Table 3.
| Study | Dataset | Methodological Advance | Main Finding |
|---|---|---|---|
| Nakamura (2018) | Apollo PSE level-2 | Wavelet packet decomposition | Velocity perturbation of +14 % in highland regolith mantle transition |
| Lognonné et al. (2021) | SELENE gravity + PSE | Joint inversion of seismic & gravity fields | Prediction of 20–30 wt % ice at 5–15 m depth near Shoemaker Crater |
| Duvall & Colaprete (2024) | LRO Mini-RF bistatic echoes | Radar-seismic correlation analysis | Correlation coefficient ρ = 0.78 between backscatter and inferred seismic stiffening |
5. Laboratory Analog Studies
5.1 X-Ray Microtomography of Ice Regolith Mixtures
Harrison Lisabeth and colleagues conducted high-resolution (< 3 µm voxel) X-ray microCT scans on a frozen mixture of JSC-1A powder with 5 % by mass distilled water. Figure 2 overlays pore-space segmentation revealing ice bridges that interlock adjacent grains, reducing porosity from 43 % to 24 % and increasing coordination number. The resultant acoustic transmission tests demonstrated a two-fold increase in effective P-wave velocity, in line with predictive contact theory.

5.2 Cryogenic Triaxial Compression Experiments
- Setup: Cylindrical cores (Ø 25 mm × 40 mm) consolidated at 10 MPa, cooled to 110 K.
- Instrumentation: Broadband piezo-electric crystals (0.1 – 800 kHz) integrated orthogonally for full waveform capture.
- Outcome: Stress-strain curves displayed brittle failure at 18 MPa for dry cores but semi-ductile yielding at 28 MPa for ice-cemented cores, compatible with acoustic modulus enhancement.
6. Computational Forward Modeling
6.1 Finite-Difference Time Domain (FDTD) Simulations
Schmerr’s team employed a 3-D staggered grid (grid spacing = 10 m, Δt = 5 ms) encoding elastic heterogeneity tuned to Diviner thermal conductivity profiles. Two scenarios were compared:
- Scenario A: Homogeneous dry regolith, Vp = 0.9 km s−1
- Scenario B: 8 % volumetric ice layer at 4 – 11 m depth, Vp = 1.6 km s−1
Peak three-component seismograms at 2 km distance reveal a clear secondary phase lag of 0.84 s in Scenario B, not present in Scenario A, delivering a diagnostic template for field comparison (Figure 3).

6.2 Monte Carlo Uncertainty Propagation
By randomly sampling plausible elastic parameters (±20 % density, ±30 % modulus), the model quantifies detection probability. Results indicate a 95 % chance of identifying ice layers thicker than 2.5 m within PSRs using four-station arrays spaced < 5 km apart.
7. Engineering Implementation: Seismometer Networks
7.1 Instrument Specifications
A consensus design is coalescing around a next-generation seismometer derived from the InSight SP instrument but radiation-hardened for extended polar night.
| Parameter | Target Value | Rationale |
|---|---|---|
| Bandwidth | 0.01 – 20 Hz | Captures deep moonquakes (<0.1 Hz) and high-frequency scattering (>10 Hz) |
| Self-Noise | < 2 (ng/√Hz) at 1 Hz | Ensures signal fidelity during low-energy thermal moonquakes |
| Thermal Range | 40 K – 400 K | Survivability over lunar diurnal extremes, especially near poles |
| Mass | < 1.8 kg | Compliance with commercial lander manifests |
| Power Budget | < 2 W (peak) | Feasible for RTG or photovoltaic supply during darkness |
7.2 Deployment Architectures
- Single-Lander, Multi-Rod Penetrators: A spring-loaded carousel deploys up to ten 0.5 m-long geophone rods radially.
- Swarm Nanosat Constellation: CubeSat-scale hoppers (< 12 kg) hop in 500 m increments, relaying data via UHF links.
- Static-Relay Hybrid: Two broadband stations anchored at crater rim highlands (continuous sunlight) act as relay nodes for four expendable low-temperature packages on the floor.
“The practical ceiling for resolved depth using passive seismic only is roughly one-tenth the dominant wavelength. Hence, to image a 30 m ice lens, instrumentation must record frequencies ≥ 10 Hz.” — Garcia et al., 2025
8. Integration with Complementary Remote-Sensing Modalities
To isolate false positives and constrain volumetric estimates, seismology must operate synergistically with at least three additional datasets, as summarized in Table 5.
| Modality | Resolution (Horizontal / Vertical) | Principal Strength | Primary Limitation |
|---|---|---|---|
| Neutron Spectroscopy (e.g., LEND) | 25 – 50 km / Bulk to 1 m | Quantifies hydrogen abundance | Poor spatial resolution |
| Synthetic Aperture Radar (SAR) | 30 m / Penetrates >5 m in dry regolith | Polarimetric discrimination of ice/high-rock-loss tangents | Ambiguity with roughness |
| Thermal Infrared Radiometry | 100 m / Surface | Constrains diurnal thermal inertia | Sensitive to albedo, requires eclipse-time observations |
| Active Seismology (Controlled Source) | 10 m / 2 – 3 m | High vertical resolution | Requires explosive or impactor payload |
9. Economic Evaluations and ISRU Return-on-Investment
Quantifying the break-even threshold for ice mining hinges on the Specific Equivalent Earth Launch Mass (SEELM), a metric that folds cryogenic storage, electrolytic processing, and transport margins into kg per kg of extracted ice. Recent studies (Metzger et al., 2026) posit that SEELM < 1 becomes attainable once ice concentration exceeds 8 wt % within 10 m of the surface and cumulative recoverable mass surpasses 450 t. Table 6 illustrates sensitivity analyses across three hypothetical sites.
| Site | Mean Ice (wt %) | Depth to Ice (m) | Recoverable (t) | SEELM | ROI (10 yr) |
|---|---|---|---|---|---|
| Shackleton Rim | 12.4 | 6.1 | 690 | 0.72 | +38 % |
| Haworth PSR | 7.8 | 4.5 | 410 | 0.98 | +5 % |
| Leibnitz Beta | 4.3 | 14.0 | 320 | 1.31 | −17 % |
10. Planetary Science and Astrobiological Ramifications
Beyond engineering, the detection and characterization of lunar ice informs models of Earth–Moon system evolution, solar system volatile transport, and prebiotic chemistry. Notable avenues include:
- D/H Isotopic Surveys: Discriminating cometary versus chondritic contributions.
- Noble Gas Trapping: Krypton and xenon isotopes in ice layers preserve ancient solar wind fluxes.
- Organic Molecule Reservoirs: PSR cores may archive complex organics shielded from UV degradation, providing a time capsule for early solar system synchemistry.
11. Future Mission Roadmap
The decadal survey envisions a tiered approach (Figure 4). Phase I entails Chang’e-7 with a micromole seismometer (mission detail) targeting Shackleton South Rim (launch ≈ 2027). Phase II expects the Artemis III surface crew to emplace the Lunar Environmental Monitoring Station (LEMS) ring in 2028. Phase III culminates with a distributed network of 12 stations (LEMS-Plus) integrated with power beamed from rectenna arrays by 2032.

12. Conclusion
Moonquake seismology, once a niche discipline eclipsed by orbital spectroscopy, is rapidly maturing into a cornerstone of lunar resource prospecting. Comprehensive theoretical frameworks, corroborated by laboratory microCT and reinforced through state-of-the-art simulations, indicate that modest arrays of ultra-low-noise seismometers can unambiguously detect subsurface ice lenses, resolve their depth extent, and approximate bulk abundance. The synergy of seismic, radar, neutron, and thermal datasets will progressively narrow uncertainties, transmuting speculative resource models into actionable mining blueprints. Concomitantly, the dataset will illuminate poorly understood chapters of lunar and solar system history. The imperative is clear: deploy, listen, and decode the Moon’s quivering whispers.
For More Information
Scientists Use Moonquakes to Locate Lunar Ice
Lisabeth et al. (2026), “Seismic Signatures of Ice-Cemented Lunar Regolith,” Science Advances
Schenk & Collins (2024), Comprehensive Review of Lunar Volatiles
NASA Science — Water and Ices on the Moon
Water on the Moon? New Study Narrows Down the Most Likely Locations