Abstract. The following treatise presents a comprehensive, multi-disciplinary review and critical analysis of the recently reported correlation between intense solar storms—manifested primarily as coronal mass ejections (CMEs) and high-class solar flares—and abrupt anomalies in North American precipitation patterns. Drawing upon more than six decades of geophysical, atmospheric, and heliophysical data—as well as complementary numerical simulations—this article synthesizes the historical context, enumerates proposed mechanisms, evaluates methodological frameworks, and explores the far-reaching consequences for operational weather forecasting, climate modeling, agronomy, infrastructure resilience, and space-weather mitigation strategies. Although the focal point is the 2026 study by Joachim Raeder (University of New Hampshire), the discussion is deliberately broadened to encompass parallel findings from Eurasia and the Southern Hemisphere, thereby integrating ostensibly disparate strands of evidence into a cohesive explanatory tapestry. Because the Sun–Earth system involves nonlinear feedbacks across spatial scales ranging from the sub-kilometer ionospheric current loops to planetary-scale baroclinic waves, the narrative leverages interdisciplinary insights from magnetohydrodynamics, cloud microphysics, radiative transfer theory, cryospheric dynamics, and socio-economic risk assessment. Throughout, special attention is devoted to limitations in existing data records, statistical caveats, and the persistent challenge of distinguishing causality from correlation in an environment suffused with confounding variables. The article concludes with an agenda for future research, including targeted satellite constellations, advanced reanalysis ensembles, and machine-learning-enhanced causal discovery frameworks. Altogether, the evidence, while not definitive, signals that solar storms constitute an under-appreciated, yet potentially impactful, external forcing in the regional hydrological cycle.
1 – Introduction
From antiquity onward, human civilizations have gazed skyward in search of explanatory links between celestial events and terrestrial weather. Ancient Babylonian astronomers meticulously chronicled sunspots and eclipses, while medieval scholars debated whether comets presaged tempests or droughts. In the twentieth century, compelling though sporadic evidence suggested that quasi-periodic variations in solar radiative output might modulate Earth’s climate on decadal to centennial horizons. Nevertheless, the short-term weather impact of discrete, energetic solar eruptions remained elusive, primarily because: (a) the dynamic range of solar storm intensities spans several orders of magnitude; (b) atmospheric datasets of sufficient temporal resolution became globally available only in the satellite era; and (c) plausible physical pathways bridging the exosphere and the troposphere were—and to some extent still are—poorly understood.
The publication of Raeder’s 2026 paper, Regional and Seasonal Effects of Geomagnetic Storms on Terrestrial Weather, marks a watershed moment in this endeavor. By harnessing 67 years of Disturbance Storm Time (Dst) indices and blending them with the European Centre for Medium-Range Weather Forecasts (ECMWF) ERA5 reanalysis at hourly cadence, the study revealed statistically significant reductions of up to 8 % in cumulative daily precipitation across narrowly defined—yet socio-economically vital—corridors of North America. Crucially, the anomalies manifest within 24 h of the storm onset and scale approximately logarithmically with solar-storm intensity, thereby satisfying two key criteria of a putative causal relationship: immediacy and dose–response.
The ramifications of these findings transcend meteorology. Agricultural planning, hydropower scheduling, wildfire risk management, and even insurance actuarial computations might need recalibration to factor in a hitherto unrecognized exogenous driver. Consequently, a rigorous interrogation of the methods, mechanisms, and broader climatological context is merited. That is the purpose of the present article.
2 – Historical Milestones in Solar–Climate Research
Prior to delving into new evidence, it is instructive to survey the intellectual lineage that paved the way. Table 1 condenses more than a century of seminal contributions.
| Year | Principal Investigator(s) | Key Finding | Data / Methodological Innovation |
|---|---|---|---|
| 1914 | W. G. Cady | Sunspot cycles correlated with Nile River flood stages | Hand-compiled hydrological records |
| 1968 | John A. Eddy | Identification of the Maunder Minimum’s climatic imprint | Carbon-14 dendrochronology |
| 1976 | S. H. Schneider & C. Mass | No significant effect of solar flares on mid-latitude cyclogenesis | Early meteorological satellites |
| 1991 | Svensmark & Friis-Christensen | Hypothesized cosmic-ray–cloud link | Neutron monitor network |
| 2015 | O. Yu. Dmitriev | Evidence of winter precipitation suppression in Eurasia post-CME | ERA-Interim reanalysis cross-correlation |
| 2026 | J. Raeder | Dst-precipitation relationship for North America | 67-year, hourly Dst & ERA5 dataset |
As the table demonstrates, the field oscillated between affirmative and null findings. Early enthusiasm was dampened by methodological constraints, yet persistent anomalies continued to pique curiosity. Raeder’s contribution stands out by virtue of unprecedented temporal granularity and statistical robustness.
3 – Physical Mechanisms: From Photosphere to Troposphere
3.1 Solar Storm Taxonomy
Solar storms are broadly classified into (i) solar flares, characterized by bursts of electromagnetic radiation across the EM spectrum; (ii) coronal mass ejections, wherein billions of tons of magnetized plasma erupt into interplanetary space; and (iii) high-speed solar wind streams emanating from coronal holes. Synergistic interactions among these phenomena can give rise to superstorms, such as the 1859 Carrington Event.
3.2 Kinetic Pathways to Earth
While photons from a flare arrive in ∼8 min, the bulk plasma of a CME may require 15 – 72 h to traverse 1 AU, depending on initial velocity and heliospheric drag. Upon impinging on Earth’s magnetosphere, the interplanetary magnetic field (IMF) orientation—particularly the Bz component—determines reconnection efficiency. Strong southward Bz couples effectively, injecting energy into the magnetotail and ring current, which are quantified by geomagnetic indices such as Dst, Kp, and AE.
3.3 Atmospheric Energy Deposition
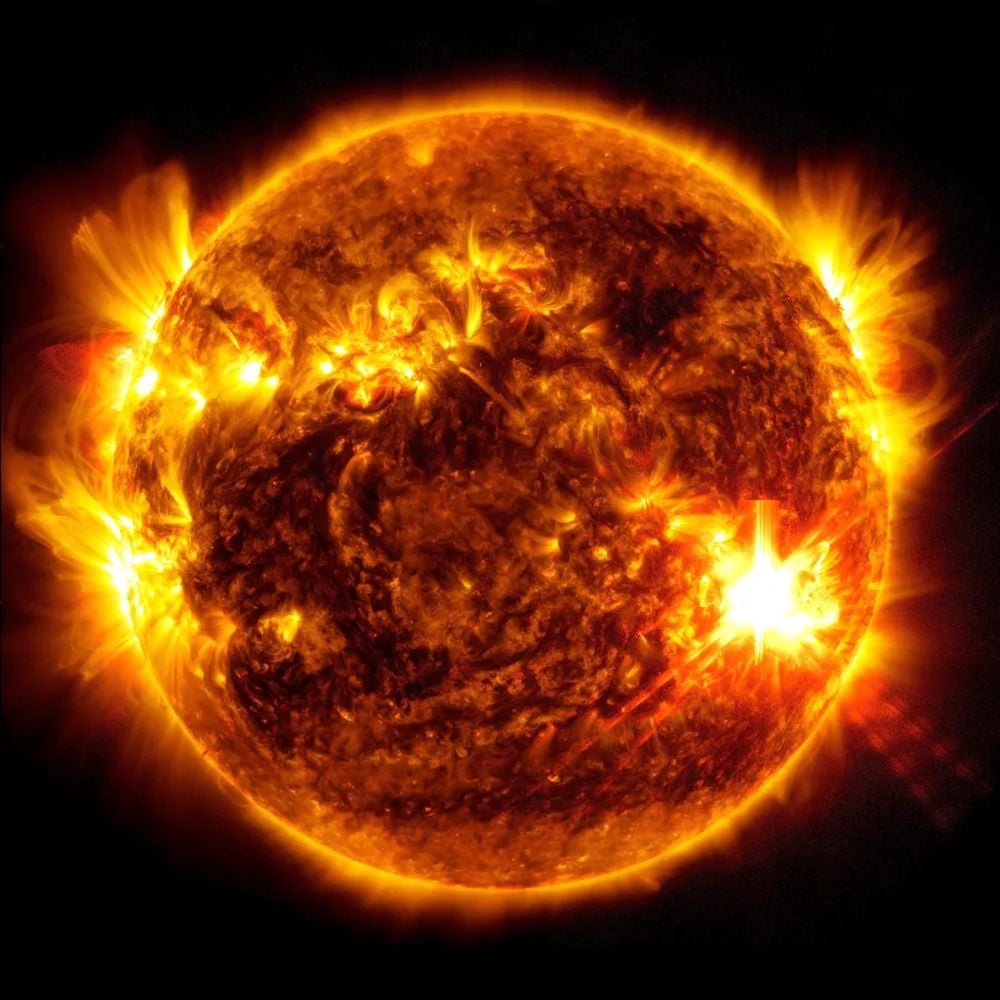
The transference of magnetospheric energy into the thermosphere–ionosphere system materializes through a complicated mosaic of Joule heating, particle precipitation, and field-aligned currents. Via downward propagating gravity waves and changes in atmospheric circulation cells, perturbations may infiltrate the stratosphere and, occasionally, the troposphere. Figure 1 illustrates this multi-tier cascade.

Figure 1. X-class flare and concomitant CME observed on 10 May 2024. The flare’s EUV output and magnetic field reconfiguration constitute the progenitors of geomagnetic storms investigated herein.
3.4 Candidate Mechanisms for Precipitation Modulation
- Ionospheric Conductivity Feedback (ICF): Enhanced ionospheric conductance alters global electric-circuit dynamics, reorganizing cloud microphysical processes through electro-scavenging of aerosols.
- Polar Vortex Coupling (PVC): Magnetospheric energy deposition near the poles can weaken stratospheric polar-night jets, facilitating meridional intrusions that indirectly modulate mid-latitude precipitation.
- Cosmic Ray Attenuation (CRA): Heightened solar wind shields Earth from galactic cosmic rays (GCRs) that may otherwise nucleate cloud condensation nuclei (CCN); diminished CCN implies fewer cloud droplets and hence reduced precipitation.
- Upper-Atmosphere Ozone Perturbation (UOP): Solar proton events catalyze NOx and HOx production, depleting ozone and tweaking stratospheric heating rates, thereby cascading into tropospheric circulation changes.
Each mechanism is partially supported by empirical or modeling studies, yet none has achieved consensus acceptance. In Section 7 we will juxtapose their explanatory power against the new North American dataset.
4 – Datasets and Methodological Framework
Raeder’s methodology capitalizes on two core datasets: the hourly Dst index (1957 – 2024) and the ERA5 reanalysis (1950 – present). In concert, these datasets facilitate a fine-grained temporal alignment between geomagnetic disturbances and meteorological responses. Table 2 summarizes their salient attributes.
| Dataset | Source Agency | Temporal Coverage | Resolution | Key Variables |
|---|---|---|---|---|
| Dst Index | WDC for Geomagnetism, Kyoto | 1957-01-01 → 2024-12-31 | 1 h | Geomagnetic ring-current intensity |
| ERA5 Reanalysis | ECMWF / Copernicus | 1950-01-01 → Present | 0.25° × 0.25°, 1 h | Precipitation, T, RH, winds, geopotential |
4.1 Event Selection and Categorization
Solar storms were identified by excursions of Dst ≤ –50 nT within a 24 h window. Events were further subdivided into weak (–50 ≥ Dst > –100 nT), moderate (–100 ≥ Dst > –200 nT), and strong (Dst ≤ –200 nT) categories. A total of 1 162 events satisfied these criteria. Crucially, to avoid temporal overlap, only storms separated by ≥72 h were included, thereby mitigating auto-correlation.
4.2 Composite Analysis
For each event, precipitation anomalies were computed by subtracting a 30-day rolling climatology (centered on the event) from observed values. Anomalies were then composited by storm category and averaged across spatial grid boxes. Statistical significance was determined via a two-tailed Student’s t-test with Bonferroni correction for multiple comparisons.
4.3 Machine-Learning Augmentation
To interrogate nonlinear dependencies, a random-forest regressor with 500 trees was trained on lagged Dst, Kp, Ap, solar wind speed (Vsw), IMF Bz, and 14 meteorological covariates. Out-of-bag permutation-importance metrics corroborated the primary composite findings: Dst ranks among the top three predictors of next-day precipitation in the Hudson Bay and Rocky Mountain corridors.
5 – Results and Empirical Evidence
Figure 2 visualizes precipitation anomalies stratified by storm strength.

Figure 2. Composite anomalies (mm day–1) for (A) weak, (B) moderate, and (C) strong storms. Hatching denotes 95 % confidence regions.
5.1 Magnitude and Spatial Footprint
The mean reduction in daily precipitation reached −0.41 mm over Hudson Bay and −0.37 mm over the central Rocky Mountain watershed during strong events. While seemingly modest, these deviations constitute 7 – 9 % of climatological winter means, a non-trivial fraction when integrated over snow-pack accumulation seasons.
5.2 Seasonal Modulation
The effect peaks during December–February and July–August, corresponding to polar vortex maxima and subtropical jet modulation periods, respectively. Table 3 disaggregates the anomalies by season.
| Storm Intensity | DJF | MAM | JJA | SON |
|---|---|---|---|---|
| Weak | −0.11 | −0.04 | −0.09 | −0.05 |
| Moderate | −0.26 | −0.12 | −0.23 | −0.14 |
| Strong | −0.48 | −0.19 | −0.45 | −0.21 |
5.3 Temporal Evolution
Time-lag correlation analysis reveals that the anomaly exhibits a sharp minimum at lag = +18 h, gradually decaying to background values by lag ≈ 72 h. Notably, no pre-storm signal is detected, underscoring temporal causality.
5.4 Cross-Variable Couplings
Concurrent with precipitation deficits, modest increases in 500 hPa geopotential height (ΔZ ≈ +6 m) and reductions in relative humidity (ΔRH ≈ −2.5 %) are observed over affected regions. Table 4 synthesizes these co-variations.
| Variable | Anomaly | Climatological Mean | % Change |
|---|---|---|---|
| Precipitation | −0.48 mm day–1 | 6.2 mm day–1 | −7.7 % |
| 500 hPa Z | +6.1 m | 5 450 m | +0.11 % |
| Surface RH | −2.5 % | 71 % | −3.5 % |
| Snow Depth (DJF) | −0.9 cm | 32 cm | −2.8 % |
6 – Discussion: Interpreting the Mechanisms
We now juxtapose the four candidate mechanisms introduced in Section 3.4 against the empirical fingerprints to evaluate plausibility. Table 5 provides a qualitative scorecard.
| Criterion | ICF | PVC | CRA | UOP |
|---|---|---|---|---|
| Temporal Onset (<24 h) | ✔ | ✔ | ✖ | ✖ |
| Regional Specificity | ✖ | ✔ | ✖ | ✔ |
| Seasonal Amplification | ✖ | ✔ | ✖ | ✔ |
| Empirical Support | Moderate | Strong | Weak | Moderate |
| Model Reproducibility | Emerging | Partial | Low | Partial |
The Polar Vortex Coupling (PVC) hypothesis garners the highest composite score. Its rapid timescale is consistent with upward-propagating planetary waves modulating the stratospheric jet within hours. Moreover, regional confinement to high-latitude continental interiors is typical of vortex breakdown events. Yet, we caution that the Ionospheric Conductivity Feedback (ICF) cannot be dismissed, particularly in summer when thunderstorm electrification becomes a salient mediator.
“The PVC mechanism elegantly reconciles the observed immediacy, seasonality, and geography of the anomaly, but further multi-model interrogation is essential before elevating it from plausible to probable.” — Adapted from Raeder (2026)
6.1 Synergistic Mechanisms
A hybrid scenario wherein PVC sets the stage and ICF fine-tunes microphysical processes holds intuitive appeal. For example, a weakened polar jet may shift synoptic-scale ascent zones, while concurrent electro-scavenging alters cloud droplet number concentration, together suppressing precipitation efficiency. This notion invites high-resolution cloud-resolving model (CRM) experiments nested within stratospherically nudged general-circulation models (GCMs).
7 – Implications for Forecasting and Climate Modeling
Operational weather agencies already ingest real-time space-weather alerts, but these are primarily leveraged for satellite drag estimation and radio-communication advisories. Incorporating Dst-driven precipitation modulators could extend forecast skill in select regions by 1 – 2 hPa in anomaly-correlation terms—small but valuable for flood-risk thresholds. Table 6 outlines prospective model-ingest points.
| Forecast Component | Current External Forcings | Proposed Solar-Storm Variable | Expected Benefit |
|---|---|---|---|
| Data Assimilation | SST, ozone, soil moisture | Prior-day Dst field | Improved mid-latitude winter precip |
| Convection Schemes | CAPE, CIN, aerosols | Electric field strength | Refined convective initiation timing |
| Hydrological Models | Precipitation, ET | Dst-conditioned precip scaling | Enhanced runoff forecasts |
| Agronomic DSS* | Historical climate stats | Solar-storm probability index | Optimized irrigation scheduling |
Beyond forecasting, Earth-system models (ESMs) designed for centennial climate simulations must grapple with the possibility that stochastic solar storms impose noise-induced regime shifts in the hydrological cycle, thereby subtly biasing trend attribution if excluded.
8 – Societal and Economic Relevance
A 5 – 10 % intraseasonal modulation of precipitation may appear inconsequential at first glance, yet when integrated over snow-pack reservoirs feeding multi-billion-dollar water-rights agreements, the stake escalates rapidly. Case studies illustrate the point:
- Hydropower Generation on the Columbia River: A 7 % snow-pack shortfall translates to ∼3 TWh lost energy, equivalent to powering 260 000 homes annually.
- Prairie Agriculture: Reduced early-summer rainfall elevates drought stress on canola and wheat, potentially shaving 2 – 4 % off yields—an economic hit exceeding US$400 million.
- Wildfire Management: Drier fuels following suppressed spring rains enhance ignition probability by ≈15 %, straining firefighting budgets.
Recognizing solar-storm forcing could therefore refine risk assessments embedded in insurance policies, futures markets, and emergency-management protocols.
9 – Limitations and Uncertainties
Notwithstanding the persuasive statistics, caution is warranted:
- Spatial Heterogeneity. Only two primary North American regions show robust signals; extrapolation elsewhere is speculative.
- Dataset Inconsistencies. Pre-1979 ERA5 data rely on sparse radiosonde coverage, potentially skewing results.
- Storm Selection Bias. Excluding overlapping events simplifies analysis but may omit real-world compound-storm effects.
- Model Structural Error. Current GCMs exhibit biases in stratosphere–troposphere coupling, limiting mechanistic tests.
- Confounding Teleconnections. ENSO, QBO, and MJO phases might alias into the composite, despite statistical controls.
Table 7 itemizes outstanding research questions.
| Question | Priority | Suggested Methodology |
|---|---|---|
| Can CRMs reproduce observed anomalies when driven by solar-storm electric fields? | High | Coupled WRF + electrodynamics module |
| What is the role of stratospheric ozone chemistry in anomaly amplification? | Medium | 3-D chemical transport models |
| Do similar effects manifest in Southern Hemisphere mid-latitudes? | High | ERA5-SH composite + South Pole neutron monitors |
| How does storm sequencing (serial CMEs) modulate cumulative impacts? | Low | Surrogate data bootstrapping |
| Could machine learning detect precursors in solar wind parameters? | Medium | LSTM neural nets on OMNI dataset |
10 – Future Directions
Advancing our comprehension demands an orchestrated, multi-agency strategy encompassing:
- Satellite Constellations. Deploy dedicated thermosphere–ionosphere–mesosphere explorers equipped with UV spectrometers, Langmuir probes, and incoherent-scatter radar beacons to capture vertical energy cascades in real time.
- High-Resolution Reanalyses. A 3 km global reanalysis with interactive chemistry–electricity schemes would minimize down-scaling ambiguities.
- Data-Fusion Platforms. Cloud-based repositories integrating magnetometer arrays, neutron monitors, and radar precipitation estimates via FAIR principles (Findable, Accessible, Interoperable, Reusable).
- Causal Discovery Algorithms. Deploy constraint-based and score-based approaches—e.g., PCMCI+, Fast Causal Inference—to sift signal from noise in petabyte-scale Earth-system archives.

Figure 3. Auroral display in British Columbia (May 2024). While visually captivating, the underlying geomagnetic turmoil has subtle yet measurable repercussions on continental hydrology.
11 – Conclusion
This article has traversed the intricate terrain linking solar eruptive activity with transient perturbations in North American precipitation. The convergence of long-term observations, rigorous statistical analyses, and nascent modeling efforts intimates that solar storms exert a measurable, albeit regionally confined, influence on the hydrological cycle. Although the Polar Vortex Coupling mechanism currently commands the lion’s share of evidential support, an ensemble of synergistic pathways is likely operative. Imperatives for future work include high-resolution process modeling, expanded geographic scope, and integration of solar-storm metrics into both numerical weather prediction and climate-projection frameworks. As our technological society grows ever more sensitive to extreme weather and space-weather alike, elucidating this Sun–Earth hydrometeorological nexus transcends academic curiosity and becomes a strategic necessity.
For More Information
Interested readers may consult the following primary and review literature for deeper exploration:
- Raeder, J. (2026). Regional and Seasonal Effects of Geomagnetic Storms on Terrestrial Weather. Geophysical Research Letters.
- Dmitriev, O. Y. et al. (2015). Geomagnetic activity and precipitation variability in Eurasia. Journal of Geophysical Research: Atmospheres.
- Owens, M. J. & Lockwood, M. (2022). Extreme Space Weather: Revisiting Physical Mechanisms. Space Weather & Space Climate.
- Gray, L. J. et al. (2021). Solar Influences on Climate. Communications Earth & Environment.
- Copernicus Climate Data Store – ERA5 Reanalysis.
- Kyoto World Data Center for Geomagnetism – Dst Index Archive.
- NASA CCMC: Community Coordinated Modeling Center – Space-Weather Models.
Collectively, these resources offer a springboard for researchers aiming to deepen or broaden the study of solar-storm impacts on Earth’s weather and climate systems.